Do you have problems getting consistent colors on your plots?
- Sometimes users change color tables that cause odd colors to be printed.
- When submitting a grayscale print of color elements yellow elements print lighter than blue elements.
- Other times users just have elements defined with the wrong color number.
These can be resolved by using Pen Tables.
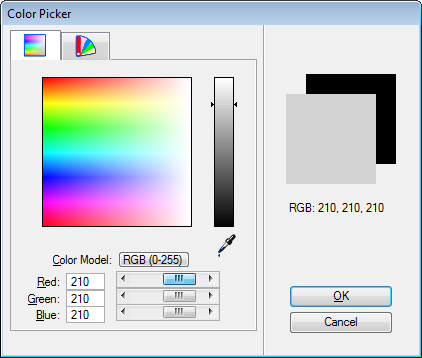
In this example, we will be setting up a pen table to fill shapes with a standard light shade of gray (210,210,210).
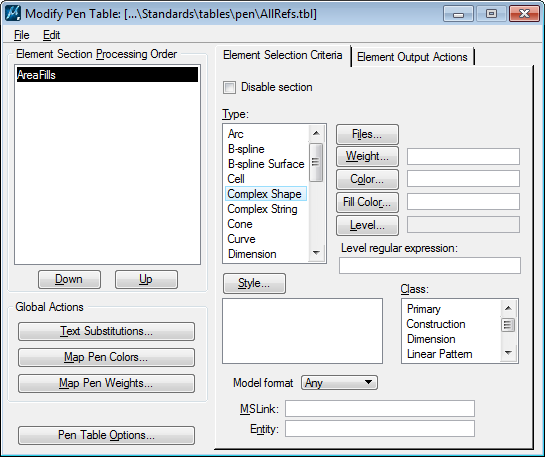
- Define the Element Selection Criteria for selecting the shapes to be filled with our standard color.

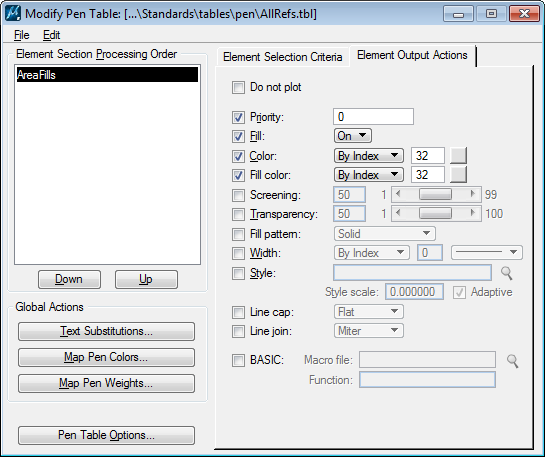
- In the Element Output Actions, many users will select a color number from their standard color table. In theory that should work, but users have been known to change color tables in which case the color index will print a different color (see bullet point 1 above).

- Some users set the color options to Grayscale. The output will be in shades of gray, but different colors convert to different shades (see bullet point 2 above).

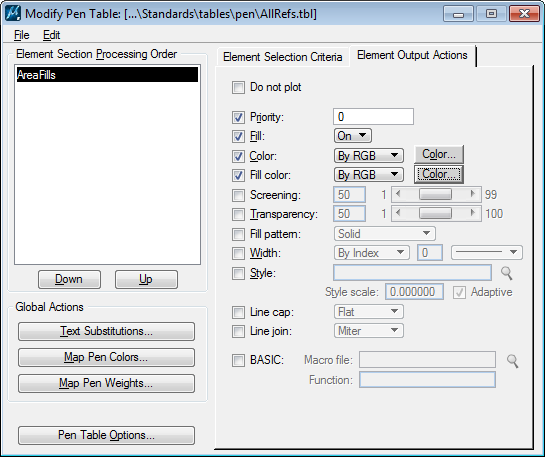
- The way to get standard color/gray shade output using a pen table is to explicitly define the desired RGB value using the By RGB settings.

- Selecting the Color… button will open the Color Picker dialog. Set the Red, Green, and Blue values as required.

- Click OK to save the color value.
See more Tips or dive deeper with Instructor-Led or Self-Paced Training.

Good informative web ..
I added your website into my bookmarks!
Keep up good work! Excited for future updates!
Best regards,
Mike