There are a couple of options that make it possible to add a report generated in OpenBridge Modeler into the Sheet Models.
First, create a report in OBM using one of the report options on the Reports and Drawing tabs.
Attaching a Bridge Report in PDF or Image Format to a Sheet Model
- In the Report Preview dialog, export the report to PDF or an image.
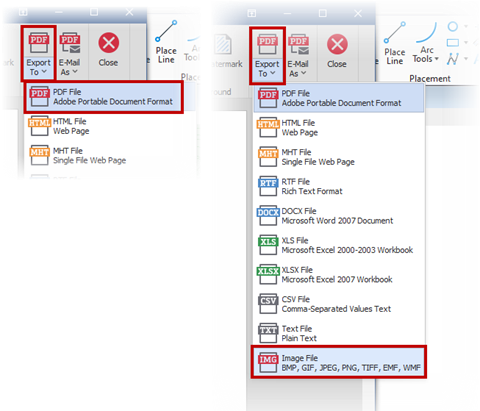
- Close the Reports dialog.
- Open the file containing the Sheet Model to place the report into and open the Sheet Model.
- Select the Attach Raster tool from OpenBridge Modeler > Home > References > Raster Manager.
- After the Raster Manager dialog opens, go to File > Attach > Raster..
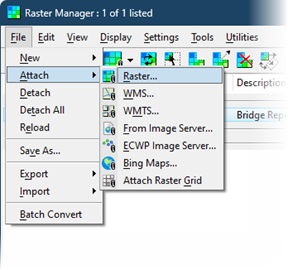
- Browse to the PDF or image file, then click Open.
- The Raster Attachment Options dialog will appear. Set the following options:
- In the Action panel, set Place Interactively to Yes. This allows the user to control where the report will be placed, and its size.
- Set any other desired settings.
- If the PDF has multiple pages, the page viewed in the attachment view area can be changed through the following steps:
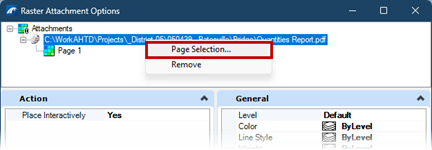
- In the Attachments section, select the attachment and right-click.
- Select Page Selection and choose the page to display. Click OK.
- Click Attach.
- Left-click to place the origin of the PDF.
- Move the cursor and left-click to place the opposite corner of the PDF.
- The PDF will be attached and displayed in the DGN. Once placed, it can be edited and moved if necessary.
Using the Place Table Tool to Bring In a Bridge Report
Another option could be to export the report as a .CSV (.XLS, .XLSX, or .CSV) file.
- Open the file containing the Sheet Model to place the report into and open the Sheet Model.
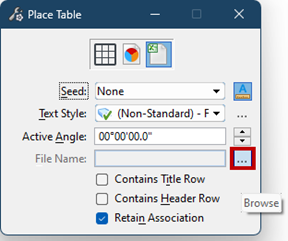
- Open the Place Table tool through Drawing > Annotate > Tables > Place Table.
- Select the Spreadsheet option, and click the ellipse (…) button to Browse to the file location in the File Name line.
- The Select Cells dialog will appear.
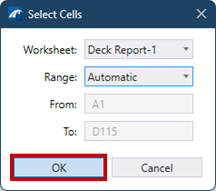
- Verify that the Worksheet is populated correctly.
- Range defines the cells shown in the spreadsheet. The three options are: Automatic, Manual, and Print Area.
- From is the top left cell from the spreadsheet and is used with the Manual Range selection.
- To is the bottom right sell from the spreadsheet and is used with the Manual Range selection.
- Set other desired settings, then click OK.
- The Generating Report display appears as the table is generated. It will disappear when complete.
- The spreadsheet will appear on the cursor to be placed where desired.